I'm using xdebug and webgrind to profile my WordPress installation because it's a bit slow. As there are some 20 plugins activated, I figured xdebug will be able to find the bottleneck.
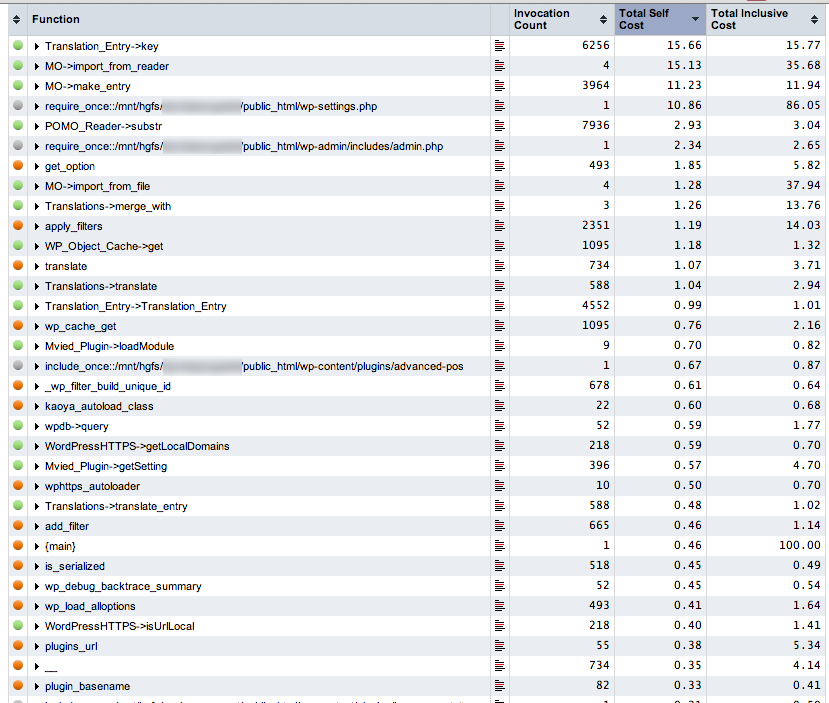
However, to my surprise, it appears that localizing routines are taking the majority part of the execution time. And yes I'm using a localized version of WordPress. Please see the following output from webgrind of a single ajax page load:

I can see some of my plugins taking less than 1% execution time each (measured in percentage of execution time). But translation routines, Translation_Entry, MO, POMO are using more than 30% of the total.
I'm wondering why this is, and whether I should prevent from using a localized version? Or am I using the wrong approach to profile performance?
